Branches are lineages
They trace populations through generations, not individual organisms.
A phylogenetic tree is a hypothesis about evolutionary history. It does not rank organisms from simple to advanced; it maps how lineages split, share ancestors, and carry evidence through time.
Each branch represents a lineage. Each split, called a node, marks a common ancestor giving rise to descendant lineages. The branching pattern is the main message: it tells us which groups share more recent ancestry with one another.
They trace populations through generations, not individual organisms.
A node is the inferred ancestor shared by all lineages that branch from it.
Living species, fossils, genes, or populations can all appear at the tips.
The sample tree below uses familiar vertebrate groups. Select a question to see how a biologist would reason from the branching pattern.
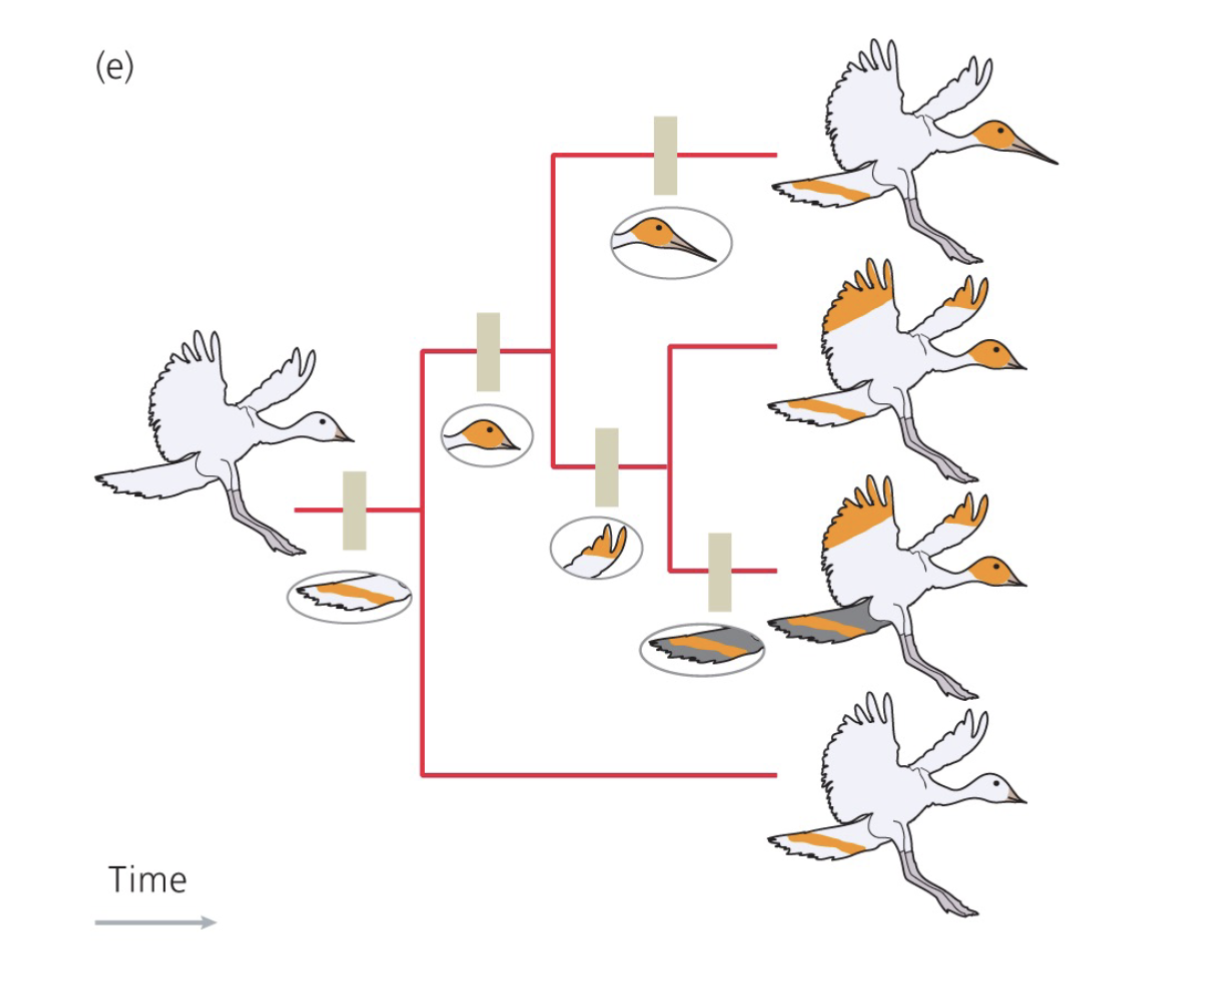
In the attached bird example, orange patches appear in different parts of the body across related birds. A phylogenetic tree helps ask whether those markings were inherited from a shared ancestor, gained independently, or modified after lineages split.
This is why tree reading is more than naming who looks alike. The placement of each trait matters because it turns a pattern of similarity into an evolutionary explanation.
A node can be turned around like a mobile hanging from the ceiling. If the same lineages still meet at the same nodes, the evolutionary hypothesis is unchanged.
Humans did not evolve from modern chimpanzees, and birds did not evolve from modern lizards. Living groups share extinct common ancestors with their relatives.
Wings in birds and bats are similar as flight structures, but they evolved independently. Phylogenies help distinguish shared ancestry from convergent evolution.
Modern phylogenetics usually combines molecular data with anatomy, development, fossils, and geography. Agreement among independent evidence makes the tree more persuasive.
Closely related species tend to have more similar sequences because fewer mutations have accumulated since their common ancestor.
The same underlying bone pattern in a human arm, bat wing, and whale flipper points to inheritance from a shared ancestor.
Reduced or repurposed features, such as pelvic bones in whales, can reveal ancestry even when the original function is no longer used.
Fossils show when traits appear and help calibrate branching events, especially when paired with radiometric dating.
Species distributions often make sense when interpreted alongside continental movement, island formation, and dispersal.
Researchers compare possible trees and ask which one best fits observed traits or sequences. Different methods formalize that question in different ways, but they all treat trees as testable hypotheses.
These are the kinds of questions that make tree reading click. Answer from the nodes first, then compare your reasoning.
Bird and lizard. Their lineages meet at the sauropsid node more recently than either lineage meets frog.
No. All living tips have been evolving for the same amount of time since their shared ancestor. The lamprey is an outgroup here because it branches off before the focal jawed vertebrates.
Not always. The trait might be homologous, inherited from a common ancestor, or analogous, evolved independently under similar selection pressures.